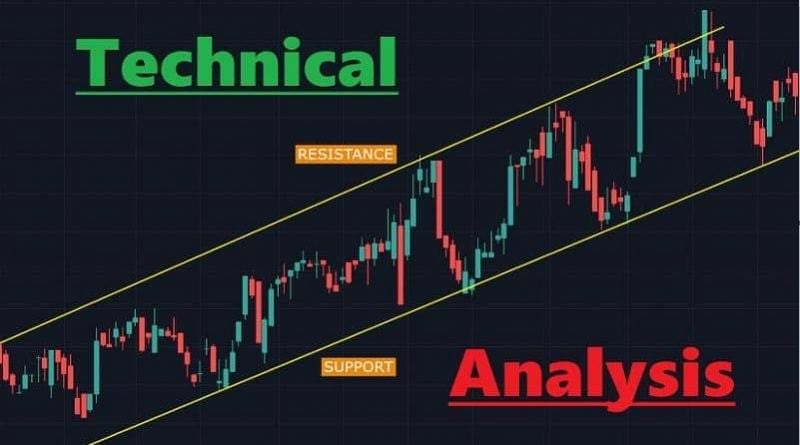
Discovering how to use technical indicators for crypto can be your game changer. Think about it. Markets move, and you watch, puzzled, as waves of red and green flood your screen. But what if you could read those waves like a seasoned surfer? Enter technical indicators—the compass to navigate the ocean of digital currency. You don’t have to guess where the market’s headed next. Instead, you can make smart moves based on sound analysis.
Get ready to dive into simple chart patterns and volume play to start. It’s time to move past gut feelings into a world where momentum indicators like RSI and MACD help you catch the next big swing. The journey won’t stop there. I’ll guide you through even more sophisticated techniques to refine your trading. From Fibonacci to Ichimoku clouds, we’re going all in. You’ll learn not just to trade but to trade with confidence. Let’s sharpen your strategy with expert tools and risk management tactics that secure your decisions. This is not just trading; it’s trading transformed.
Understanding the Foundation of Crypto Technical Analysis
Decoding Chart Patterns for Predictive Insights
Patterns in cryptocurrency charts are crucial. They guide us to make smart trades. Think of them as trails left by price movements. They hint at what may come. It’s like weather forecasting. But instead of clouds, we look at lines and shapes on charts.
The most common patterns are triangles, head and shoulders, and flags. Each has its own story. A triangle often signals a big price move is coming. Head and shoulders? They suggest a trend may flip. Flags show a pause. Like catching your breath before running again.
To spot these, check past prices on a cryptocurrency trading platform. Trace the highs and lows. Soon, the shapes pop out. It’s part art, part science – a knack you develop over time. Your goal: catch a pattern before it’s clear to all. This puts you in a good spot to trade before the herd.
The Integration of Volume in Technical Interpretations
Volume is a tale-teller. It shows how much of a crypto traded in a time frame. High volume can mean a pattern is strong and worthy. Low volume is like a soft whisper – unsure and often ignored.
Why does volume matter? When a pattern breaks with high volume, trust it more. A breakout with thin volume is like a weak handshake – not convincing. But a hearty surge in volume? That’s a firm handshake, sealing the pattern’s promise.
In crypto technical analysis, volume pairs with price. Moving averages help here. They smooth out price moves across days or weeks. This can show a trend’s strength. If volume climbs with price, trust that trend more. If volume falls, be wary. It might trick you.
Think of it like many voices. A rally with more voices – that’s volume – is a chorus that carries far. A rally with few voices does not lead a convincing charge.
Learning such skills makes you a better trader. It takes time, but once you get it, you hold a key to unlock profits. Combine pattern knowledge and volume reading. This brings sharper trades into your view.
Remember, all this is part of your toolkit. No tool is perfect. Each has a role. You balance them to find the best trades. And as you blend these tools, your trades get sharper, your strategy sounder. You turn crypto’s chaos into a set of steps you can dance to. And with each right step, the dance of trading leads to profit.
Mastering Core Technical Indicators for Crypto Trading
Utilizing RSI and MACD for Momentum Analysis
Momentum is key to winning in the crypto game. RSI shows if crypto is bought or sold too much. When RSI is over 70, it screams, “Watch out, we’re too high!” And when it dips below 30, it whispers, “Hey, maybe it’s time to buy.” It’s like a crypto heartbeat, really.
MACD is another cool buddy that helps us spot trends. It’s got two lines that cross. When they kiss, it’s a sign. A bullish sign is when the fast line jumps over the slow one. And when it ducks below, it’s like it’s saying, “Hold on, the party might be over.”
The Role of Bollinger Bands and Moving Averages in Market Analysis
Now let’s talk Bollinger Bands. They’re like rubber bands for price action. When they squeeze tight, a big move’s coming. Think of it as the calm before the storm.
Moving averages smooth out price data. They help us see the trend. The cool part? They work like magic lines that crypto doesn’t like to cross. It bounces off them a lot.
Using these tools, we can spot where the market’s headed. It’s not always spot-on, but it gives us a solid game plan. Check out price charts and you’ll see these indicators in action. They make the game of crypto a bit less wild.
Remember, the goal is to buy low, sell high, and never get caught up in the hype. Keep your head cool and let these indicators be your guides.
Advanced Techniques in Cryptocurrency Analysis
Fibonacci Retracement and Ichimoku Cloud Strategies
Trading well in crypto means spotting patterns. Two big helpers here are Fibonacci retracement and Ichimoku Cloud. They both predict future price moves. Fibonacci retracement levels show where prices could pause or reverse. To use it, draw lines between high and low price points. Prices often turn at these lines for reasons traders still debate. What’s clear is they work like magnets for price action.
Ichimoku Cloud is like a Swiss army knife for your charts. It gives signals on trend direction, momentum, and strength all at once. Its lines tell you buying and selling points. It’s versatile but needs time to learn well. The Cloud turns green or red. Green means “go for buying” and red means “wait” or “consider selling.”
Combining Stochastic Oscillator and Candlestick Patterns for Precision
Let’s talk about pairing tools for better trade calls. The stochastic oscillator helps spot trend reversals. It rates current prices against a range over time. When you see it above 80, crypto might be overbought. Below 20, it might be oversold. These points can signal a price shift.
Candlestick patterns add to this story. They’re pictures of price moves that can forecast where prices might head next. Like the stochastic, they work best with other tools. A candle with a small body and long wick can mean a reversal. If you see this with an overstretched stochastic, you might prepare for a trade.
These tools help see the crypto market clearer. And using more than one at once is smart trading. They guide you towards better buy or sell choices. And in a wild market like crypto, every edge counts.
Refining Crypto Trading Strategies with Expert Tools
The Importance of Risk Management in Indicator Application
Risk management is the heart of trading. No risk, no fun, right? Wrong. Too much risk, and you’re out faster than you can say “blockchain.” So, let’s talk shop—smart shop.
First off, indicators are your pals. Think of RSI— the relative strength index. It tells you if a coin is overbought or oversold. Keep it simple; high RSI, maybe sell. Low RSI, maybe buy. But watch out! The keyword here is “maybe.”
Same goes for Bollinger Bands. Picture this: a rubber band. Pull too far, it snaps back. Bollinger Bands are like that. If the price hits the top band, watch out. It might snap back down. Hit the bottom, possibly going up.
But here’s the big secret—don’t rely on one indicator alone. Mix them like your grandma’s cookie recipe. Blend RSI with the MACD histogram, which shows you momentum. Stir in some volume data to taste. Now, you’ve got a strategy.
And remember, keep your emotions checked. Indicators help here, too. They’re like a cold splash of water when you’re about to make a heat-of-the-moment trade.
Identifying Optimal Entry and Exit Points with Sentiment Analysis and Trend Lines
Getting in and out of trades at the right time—gold, right? That’s where crypto trend lines and sentiment analysis come in. Let’s break it down.
Trend lines are like a map of the market’s mood. Up trend, good times. Down trend, not so much. So watch those lines like a hawk. But be quick! Crypto moves fast, and you’ve got to keep up.
Now mix in sentiment analysis. This is where you feel the vibe. What’s the crowd saying? Are they all aboard the hype train, or is the fear of missing out kicking in? Use this to spot the ideal spots to enter or exit a trade.
You’re sailing the seas of charts and graphs. Sometimes you ride the wave, sometimes you crash. But if you use your trend lines and feel the market’s pulse, you’re more likely to catch the perfect wave.
Remember, don’t just use your gut. Use your tools. Crypto trading signals, those little beacons of light in the dense fog of digital currency trading, can guide the way.
In short, trading in the crypto world can be wild. But with the right toolkit—RSI, MACD, Bollinger Bands, and a pinch of market sentiment—you give yourself a fighting chance. Stay smart, manage your risk, and let those indicators be your compass. Happy trading!
In this post, we dove deep into crypto technical analysis. We looked at chart patterns and volume to predict market moves. Then, we mastered key indicators like RSI, MACD, Bollinger Bands, and moving averages. These tools show us momentum and market trends. We also tackled complex strategies like using Fibonacci retracement and the Ichimoku Cloud. Plus, we saw how the stochastic oscillator and candlestick patterns refine our predictions.
Finally, we talked about using expert tools for better trading decisions. Risk management is crucial for using indicators well. We also covered how sentiment analysis and trend lines help us enter and exit trades at the best times.
I’m excited about these techniques and their power to boost your crypto trading skills. Remember, practice makes perfect. Keep learning and stay ahead in the fast-moving world of cryptocurrency.
Q&A :
What are technical indicators and how do they apply to cryptocurrency trading?
Technical indicators are mathematical calculations based on historical price, volume, or open interest information that help traders identify certain trends and signals within the markets. In the context of cryptocurrency trading, technical indicators can provide insights into market sentiment, trend direction, momentum, and potential reversals. Traders use these tools to make more informed decisions when buying or selling crypto assets.
How can I incorporate technical indicators into my crypto trading strategy?
To effectively use technical indicators in your crypto trading strategy, start by selecting a few that complement each other and address different aspects of the market, such as trend-following indicators (e.g., moving averages) and oscillators (e.g., Relative Strength Index). Apply these indicators to your price chart, and look for convergence or divergence that suggests potential entry and exit points. It’s essential to backtest your strategy and adjust your indicators to fit the specific characteristics of the cryptocurrency market you are trading in.
What are some popular technical indicators for analyzing cryptocurrency markets?
Some of the most popular technical indicators for analyzing cryptocurrency markets include:
- Moving Averages (Simple and Exponential)
- Relative Strength Index (RSI)
- Moving Average Convergence Divergence (MACD)
- Bollinger Bands
- Volume Weighted Average Price (VWAP)
- Fibonacci Retracement Levels
Each indicator has its unique method of interpreting the market, so it’s valuable to understand how they work and in what situations they are most effective.
How often should I adjust my technical indicators when trading crypto?
The frequency of adjusting your technical indicators will depend on your trading style and the market conditions. Day traders may adjust their settings more often to account for the high volatility and shorter time frames, while long-term traders might keep their indicator settings consistent. Always be aware of market changes, news, and other fundamental factors that could impact the effectiveness of your technical indicators.
Are technical indicators alone sufficient for successful crypto trading?
While technical indicators can be powerful tools, relying on them alone may not be sufficient for successful crypto trading. Combining technical analysis with fundamental analysis, which includes examining market news, project developments, and broader economic factors, provides a more comprehensive approach to trading. It’s also crucial to manage risk appropriately and maintain discipline in following your trading plan.


