How to read a cryptocurrency chart for beginners? Cryptocurrency charts may seem like a maze, but fear not! They’re your compass in the thrilling world of digital assets. Let’s unravel their secrets and empower you to make informed investment decisions.
What is a Cryptocurrency Chart?
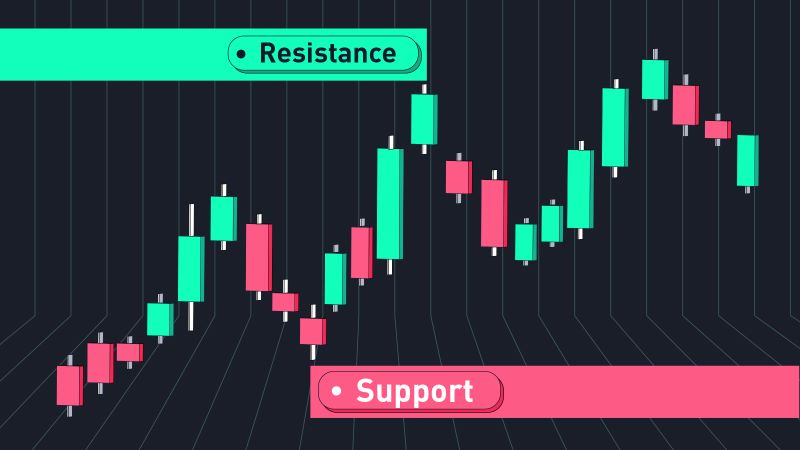
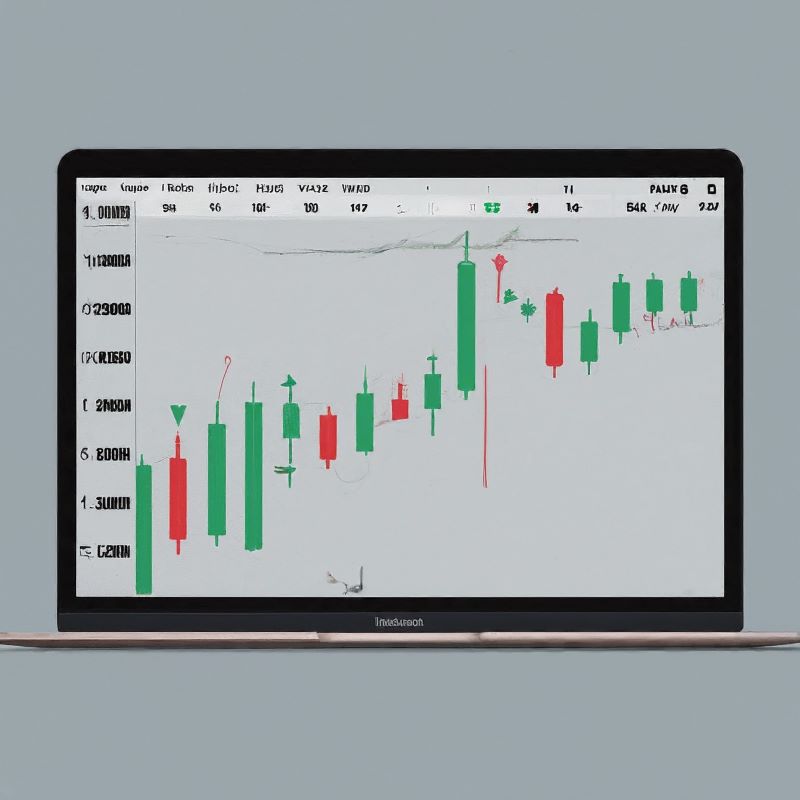
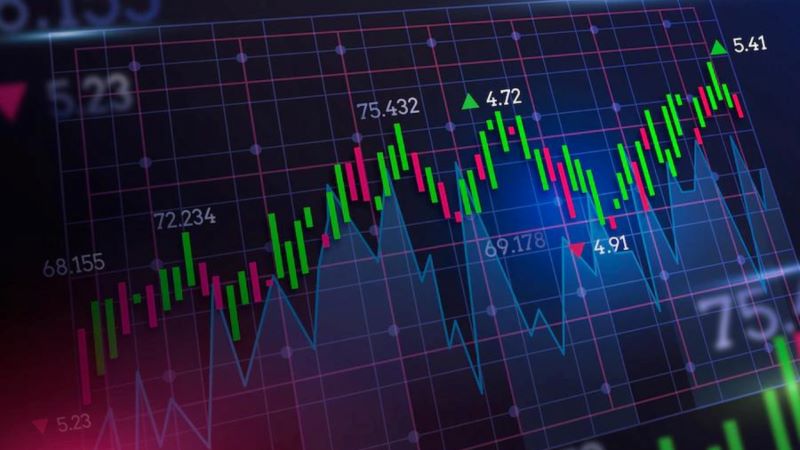
A cryptocurrency chart is a visual representation of a cryptocurrency’s price history over a specific period. Much like charts used in traditional finance, cryptocurrency charts plot price movements, providing valuable insights into market trends, momentum, and potential trading opportunities. These charts serve as essential tools for both novice and experienced investors seeking to navigate the volatile world of digital assets.
What is a Cryptocurrency Chart?
The Different Types of Cryptocurrency Charts
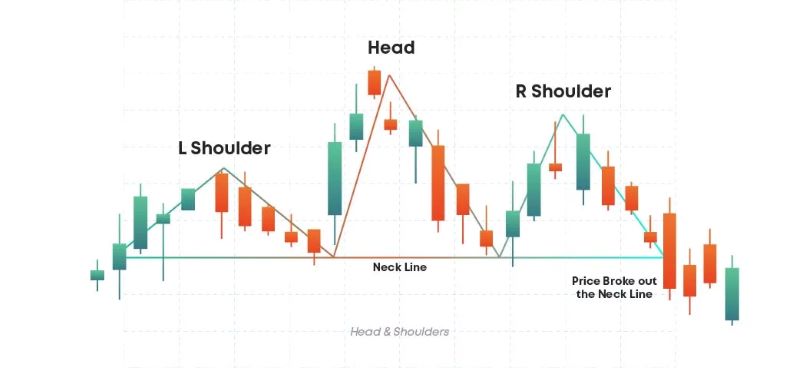
While numerous variations exist, the most common types of cryptocurrency charts include:
- Line Charts: These basic charts connect closing prices over time, offering a simple representation of price trends.
- Candlestick Charts: Originating from 18th-century Japanese rice trading, candlestick charts provide a more detailed view. Each “candlestick” represents a specific timeframe, displaying the opening, closing, high, and low prices for that period.
- Bar Charts: Similar to candlestick charts, bar charts display the same price information but represent it with vertical bars and horizontal lines.
Types of Cryptocurrency Charts
Why Are Crypto Charts Important?
Cryptocurrency charts are crucial for several reasons:
- Charts help traders spot bullish (upward) or bearish (downward) trends, allowing them to make informed trading decisions.
- The volatile nature of cryptocurrencies becomes evident in chart patterns, enabling traders to assess risk and potential rewards.
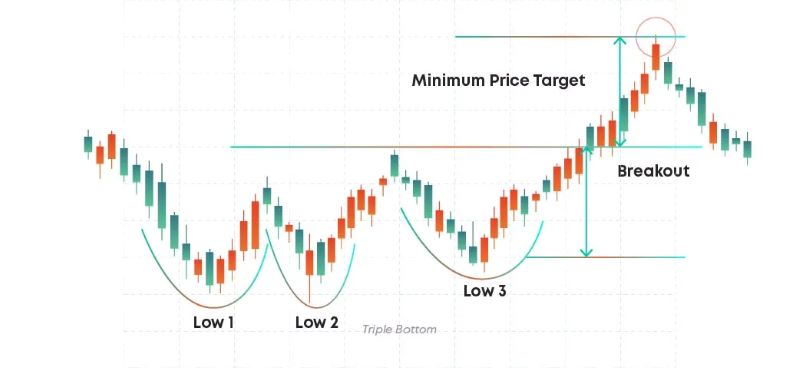
- Charts reveal patterns and signals that can indicate potential buying or selling points.
- Chart patterns often reflect the overall sentiment of the market, offering clues about investor confidence or fear.
Key Components of a Cryptocurrency Chart
Understanding the core components of a cryptocurrency chart is crucial for accurate interpretation:
Price Axis (Y-axis)
The vertical axis, known as the Y-axis, displays the price of the cryptocurrency. This axis helps determine the price range and fluctuations over the chosen time frame.
Time Axis (X-axis)
The horizontal axis, or X-axis, represents the time period being displayed. This could range from minutes to years, depending on the chart’s settings and the user’s preference.
Candlesticks/Bars/Line Charts
As mentioned earlier, these visual representations of price data form the core of the chart, each offering a different level of detail.
Trading Volume
Often displayed below the price chart, trading volume bars indicate the total number of units traded within each timeframe. High trading volume can signify significant price movements and market interest.
How to read a cryptocurrency chart?
How to Read Candlestick Charts
Candlestick charts, with their rich information density, are favored by many traders. Here’s how to interpret them:
What is a Candlestick?
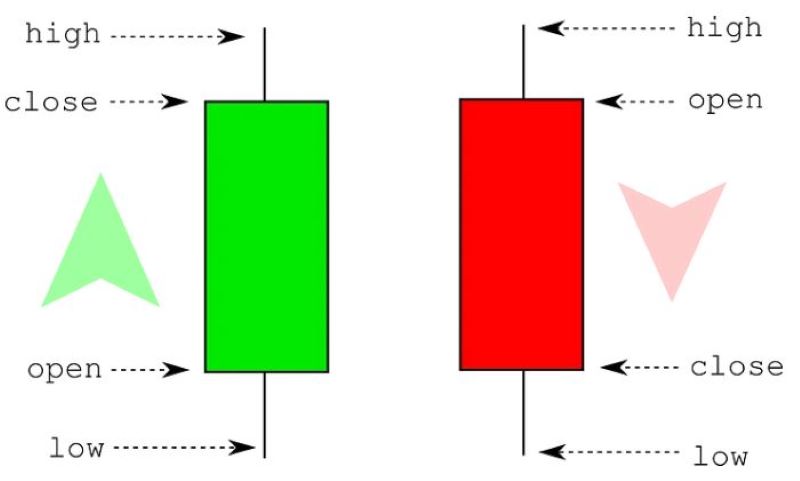
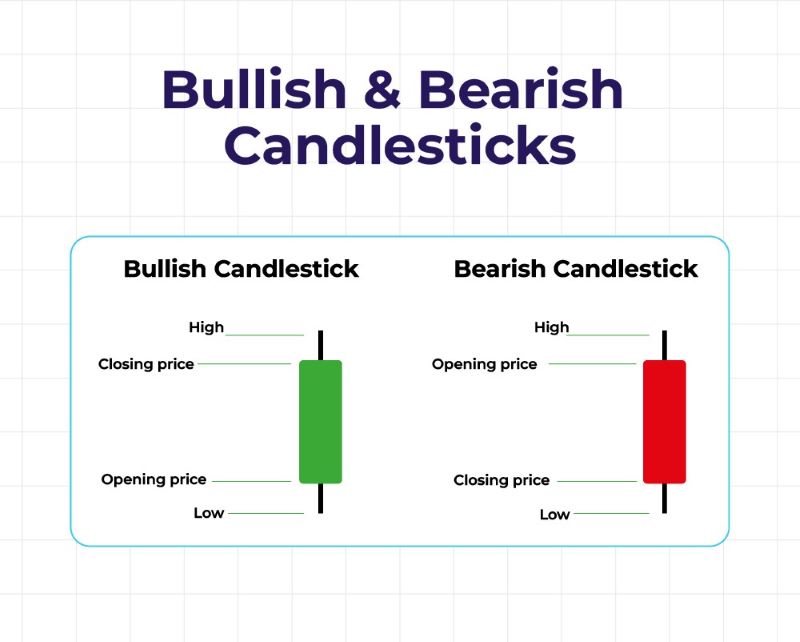
Each candlestick represents a specific time period. Composed of a “body” and “wicks” (or “shadows”), they visually represent price action:
- Body: The rectangular body represents the price difference between the opening and closing prices.
- Wicks: The thin lines extending from the body, the wicks, illustrate the highest and lowest prices reached during the time period.
Understanding Bullish and Bearish Candlesticks
- Bullish Candlesticks: Green or white candlesticks typically represent buying pressure and a potential upward trend. These candlesticks often have a higher closing price than the opening price.
- Bearish Candlesticks: Red or black candlesticks suggest selling pressure and a potential downward trend. These often have a lower closing price than the opening price.
Candlestick Patterns for Beginners
Several basic candlestick patterns can provide valuable insights even for beginners:
- Hammer: A hammer pattern, with its long lower wick and small body, can indicate a potential price reversal from bearish to bullish.
- Doji: Doji candlesticks have a very small body or no body at all, signaling market indecision.
- Engulfing Patterns: These two-candlestick patterns occur when one candlestick completely “engulfs” the previous one, potentially indicating a trend reversal.
Essential Technical Indicators for Crypto Chart Analysis
Beyond basic chart reading, technical indicators offer additional insights:
Moving Averages (MA)
Moving averages smooth out price data, highlighting trends by filtering out noise. Common MAs include the 50-day and 200-day MAs. When the shorter-term MA crosses above the longer-term MA, it can signal a bullish trend.
Relative Strength Index (RSI)
The RSI measures the magnitude of recent price changes to evaluate overbought or oversold conditions. An RSI above 70 typically suggests an overbought market, while an RSI below 30 indicates an oversold market.
Moving Average Convergence Divergence (MACD)
The MACD is a trend-following momentum indicator. It identifies potential buy and sell signals by comparing two moving averages and their relationship to a signal line.
Tips for Using Technical Indicators Effectively
- Combine Indicators: Use multiple indicators to confirm signals and improve accuracy.
- Context is Key: Consider market sentiment and news events alongside technical indicators.
- Backtesting: Test indicator strategies on historical data to assess their effectiveness.
Reading cryptocurrency charts is the first step towards becoming a savvy investor. With practice and a keen eye on market trends, you’ll be well on your way to making informed decisions. For further insights and detailed chart analyses, head over to Dynamic Crypto Network.
