Are you ready to dive into the world of crypto trading? To make smart trades, you need to grasp basic technical analysis for cryptocurrencies. It’s not as daunting as it might sound. I’ll walk you through the charts and trends that reveal what the market’s doing and where it’s headed. Stick with me, and you’ll soon see patterns and indicators that were once just a jumble of lines and shapes. Let’s decode those market mysteries together.
Deciphering Market Trends with Technical Analysis
Understanding Price Action and Candlestick Patterns
Reading Candlestick Charts for Predictive Clues
When trading crypto, you need a sharp eye on price action. What’s price action? It’s just the way prices move – up, down, or flat over time. We look at candlestick patterns to get a quick read on the market mood.
Candlesticks seem tough, but think of them as simple pictures of prices. Each one can tell a story. They show us the opening price, the high and low of the session, and the close. A green candle means the price went up. A red one shows it went down.
A single candlestick can give a hint. But a group tells a fuller tale. Think of the “Three White Soldiers.” It’s a trio of green sticks. They march up and suggest buyers are taking over. It’s a bullish sign – meaning prices might keep climbing.
Identifying Crypto Market Trends and Volume Analysis
Assessing Market Sentiment Through Trading Volume
Now, let’s talk about trend lines and volumes. A trend line is a simple drawing that shows where the price might head. It connects low points in an uptrend and high points in a downtrend. It’s like a road map for prices.
Trading volume is how much of a crypto is bought or sold over time. It’s like a crowd at a concert. The more people there, the louder it gets. In trading, a big volume means a lot of interest. It can make the price move more.
Volume can help you get the feel of the market. It can tell you if a price move is strong or just a weak whisper. A price jump on low volume might not mean much. But if it happens on high volume, pay attention. A lot of folks are getting behind this move.
When prices reach a ceiling (resistance) or a floor (support), it means they’re taking a breather. If a price breaks through that ceiling, it might soar higher. If it falls through the floor, watch out – it could drop more. These levels map out zones where prices could change their path.
Remember, charts and volumes are tools, not crystal balls. They can’t predict the future with certainty. But they help us make educated guesses. They give us clues, like detectives at a crime scene. And in the world of crypto trading, that’s a big edge.
No tool is perfect, and markets can surprise us. So, always have a plan and never risk more than you can afford to lose. Happy charting!
The Role of Technical Indicators in Enhancing Your Trading Strategy
Moving Averages: The Backbone of Crypto Trend Analysis
Crafting Strategies Around Moving Averages
Moving averages smooth out price action. They show the average price over time. This is great for spotting trends. Think of them like a ship’s wake, telling you where it’s been. When prices rise above the moving average, that’s good news! It shows bulls are in charge. Prices below mean bears have the upper hand.
Now, there are different types. Simple Moving Averages (SMA) and Exponential Moving Averages (EMA) are most common. EMA gives more weight to recent prices. This makes it react faster to price changes than SMA.
Mastering Oscillators: MACD, RSI, and Stochastic
Timing Your Trades with Oscillators
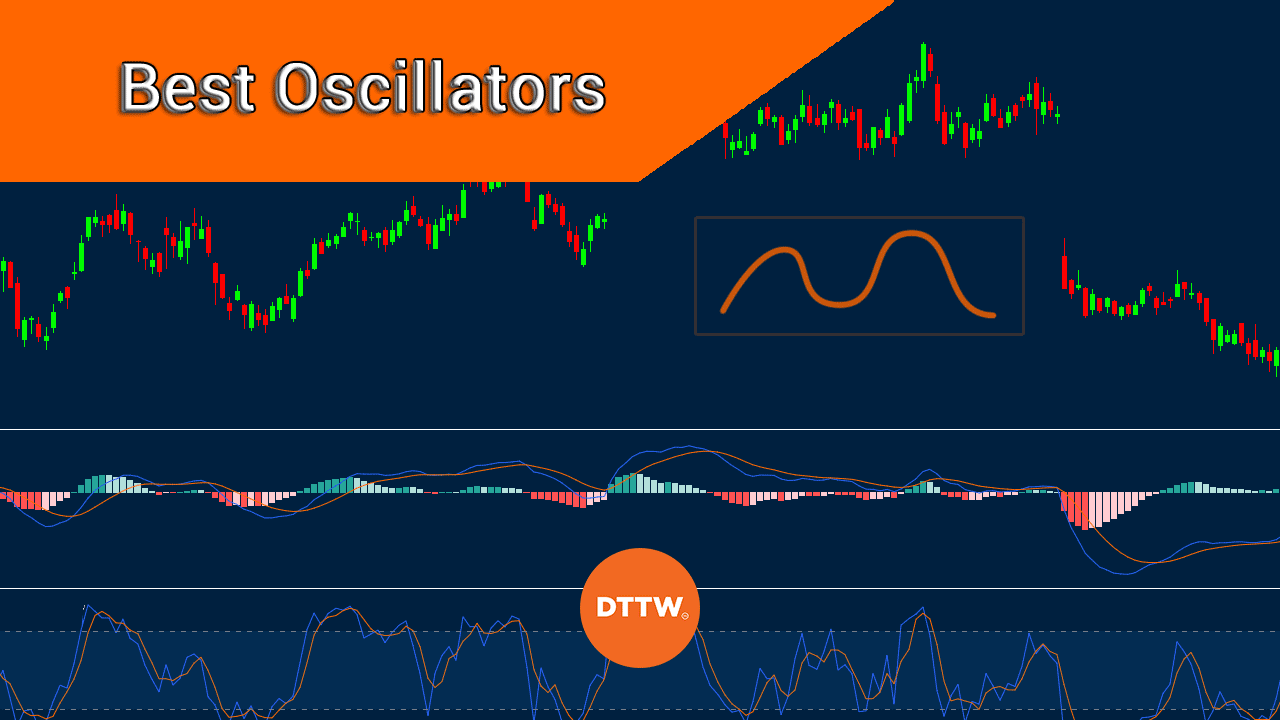
Oscillators are like your crypto compass. They help navigate through market noise and spot strong trends. MACD, RSI, and the Stochastic oscillator, well, they’re your best mates here. MACD stands for Moving Average Convergence Divergence. It helps by showing the relationship between two EMAs.
RSI, or Relative Strength Index, tells you if crypto is overbought or oversold. It’s a value between 0 and 100. Over 70 means it’s time to watch out. Prices might fall, as it’s overbought. Under 30? Might be a good chance to buy.
Then there’s the Stochastic oscillator. It compares a crypto’s closing price to its price range over a certain time. This also spots overbought or oversold conditions.
Using these tools, you can make some smart plays. Like buying when the market’s fear has pushed prices too low. Or selling when greed shoots them up too high.
Now, add these indicators on your chart. Look for moving averages crossing over. Check RSI stepping over 70 or under 30. Watch the Stochastic leaving these zones, too. When they all whisper the same secret, that’s your cue!
Remember, these tools aren’t crystal balls. Yet, they are powerful for making informed decisions. Respect their signals, but always check other signs before jumping in. Happy trading!
Navigating Support, Resistance, and Chart Patterns
Drawing and Utilizing Trend Lines in Crypto Analysis
When you look at a crypto chart, you see lines going up and down. These are trend lines, and they show price action in crypto trading. They help us spot which way prices might go next. You draw them to link up highs or lows in price. Trend lines point out where prices might rise or fall to. They can show you when to jump into the market or step back.
How do you use trend lines to predict future price movements? You check past prices and draw a line. This line then helps forecast where prices might go.
Let’s say prices keep touching a line but not crossing it. That line is now a “support” level. It’s like a floor that prices don’t want to drop through. If prices start to fall, this line could help catch them. But if the prices slice through, look out below!
On the flip side, a “resistance” level is like a ceiling. Prices reach this line but struggle to push past it. When prices finally burst through, they may surge higher.
Strengthening Positions with Support and Resistance Levels
Support and resistance levels are key in cryptocurrency charts analysis. They tell us where buyers and sellers have battled before. With this knowledge, you can make better guesses on where prices might turn around.
Why do support and resistance levels matter in trading? They show where big fights between buyers and sellers happen. Knowing this, you can spot chances to buy or sell.
If prices hover near a support level, it might be a good time to buy. That’s because prices could bounce back up. But if they drift near resistance, you might think about selling. Prices could fall from there.
Advanced Chart Patterns and Breakout Strategies
Apart from trend lines, there are shapes in the charts that repeat. We call these chart patterns. They tell stories of past price battles and hint at what’s next. Some patterns mean prices might jump up, like “cup and handle” or “flags.” Others, like “head and shoulders,” suggest prices might tumble down.
What do advanced chart patterns indicate about future price movements? They signal if prices might leap or drop soon.
Trade Setups: Bollinger Bands and Fibonacci Retracements
Bollinger Bands and Fibonacci retracement work together for trade setups. Bollinger Bands wrap around prices on a chart. They squeeze tight or widen out, hinting at how prices might move. Fibonacci retracements trace lines where prices often take a break or reverse.
How do Bollinger Bands and Fibonacci retracements aid in making trading decisions? They help you find spots to enter or exit trades.
Bollinger Bands can warn you if prices might turn around. If prices touch the band’s edge, a change could be near. Fibonacci retracements aim for key levels where prices have turned before. If prices near these levels, watch out; they may flip direction.
When trading, these tools become your map and compass. They guide through the jungle of price action. With their help, you can brave the wilds of crypto markets.
Leveraging Advanced Technical Analysis for Strategic Trading
Incorporating Ichimoku Cloud and Elliott Wave Theory
Applying Ichimoku for a Comprehensive Market View
Trading cryptocurrency can feel like a wild ride. But don’t worry! I’ve got some cool tools to share. Let’s start with the Ichimoku Cloud. It sounds fancy, right? It’s a chart used in trading. It tells us where prices may go. It combines past prices with current ones to predict future trends. This cloud acts like a map. When prices are above the cloud, it’s often a good sign. When they’re below, watch out!
The Ichimoku Cloud gives traders a full view of the market. It shows if a trend is strong or weak. That’s because it uses five lines, not just one. Each line is like a piece of a puzzle. Together, they show us clear support and resistance levels. These levels are areas where prices might change direction. Knowing this can help us decide when to buy or sell.
Volume-Based Indicators and Crypto Trading Signals
Utilizing On-Balance Volume and Accumulation/Distribution Metrics
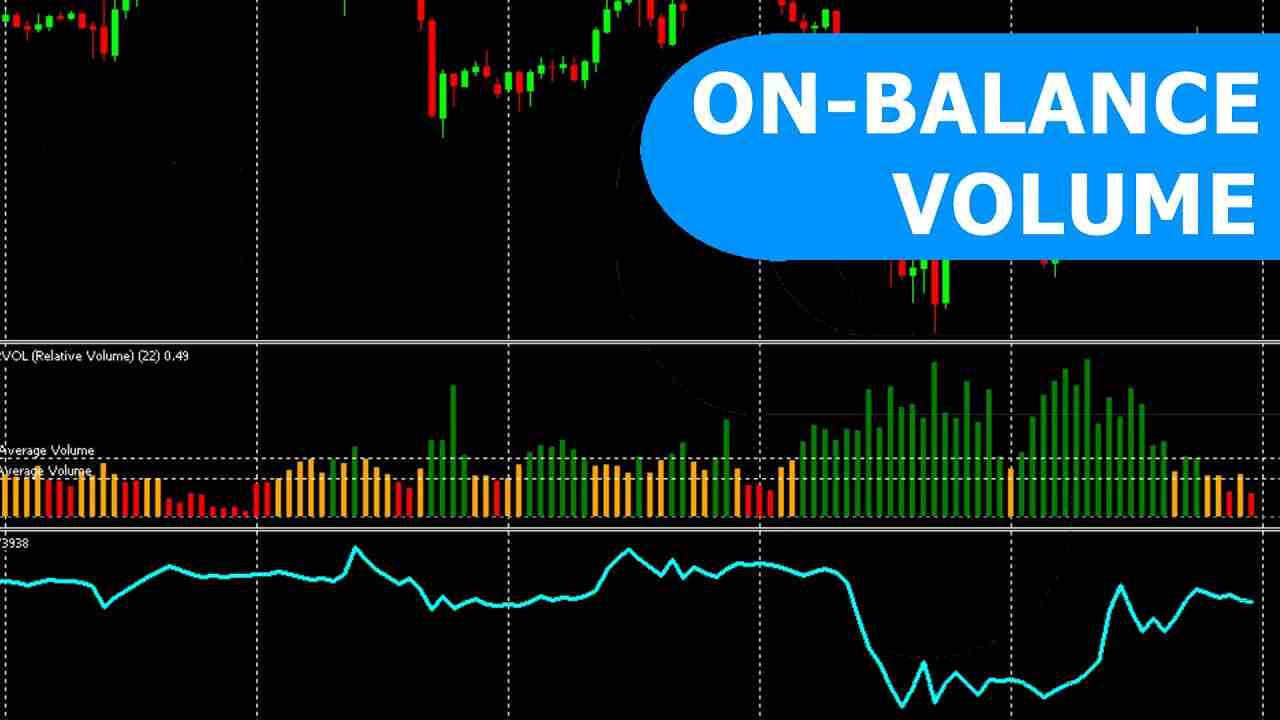
Now, let’s talk about the stuff behind the scenes—volume! Volume tells us how many crypto coins were traded. It’s a sign of how much interest there is in a coin. There are cool tools like On-Balance Volume (OBV) and Accumulation/Distribution metrics. They sound complicated, but they’re not too tough. They help us see the force behind price moves.
OBV adds up volume on up days and subtracts it on down days. If the numbers go up, that’s good. It means people are buying. When OBV drops, that’s a warning. Fewer people might want the coin. Accumulation/Distribution is similar. It looks at where the price closes and compares it to the highs and lows. It shows if buyers or sellers are in charge. This helps us guess where the price will go next.
These tools are gems for any trader’s toolkit. They can improve your trades by showing the strength of market moves. Want better trades? Pay attention to these volume indicators. They could make all the difference!
Remember, this stuff may seem tricky at first. But with practice, you can use these tools to help make smart trades. They give us clues about what’s coming next in the crypto world. So dive in, learn these indicators, and watch your trading improve!
In this post, we explored how to read market signs, sound out trends, and sharpen our crypto trading using technical analysis. We began with candlestick charts, using them to spot hints that push us to smart moves. Then, we dug into how trading volume can show market mood swings, a key insight for any trader.
We also broke down how moving averages and oscillators like MACD and RSI are crucial. They help us figure out when to jump in or out of a trade. Plus, we covered how to use trend lines and why support and resistance levels are vital.
Finally, we discussed advanced tools like Ichimoku Cloud and Elliott Wave Theory. We saw how they give us an edge by folding in lots of data to shape our trading plan. Tools like On-Balance Volume teach us to read behind the scenes, to trade based on more than just price.
Grasping these tools and tactics can transform how you trade. Stick with them, and you’ll trade not just with more know-how, but with greater confidence.
Q&A :
What is basic technical analysis in the context of cryptocurrencies?
Technical analysis in the world of cryptocurrencies refers to the practice of analyzing historical price data and trading volume to forecast the future movements of cryptocurrency prices. It involves looking for patterns and trends in charts that can indicate potential buy and sell signals. This approach assumes that financial markets, including crypto markets, are influenced by past trading behavior and that history may repeat itself.
How can beginners start using technical analysis for cryptocurrency trading?
Beginners can start by familiarizing themselves with the most common chart patterns and technical indicators. Basic chart patterns include trends, support and resistance levels, and volume analysis. Technical indicators such as Moving Averages (MA), the Relative Strength Index (RSI), and the Moving Average Convergence Divergence (MACD) can provide additional insights. It is essential to start with a demo account to practice without financial risk and to always continue learning about new tools and strategies.
Which technical indicators are most useful in analyzing cryptocurrency trends?
Some of the most useful technical indicators for analyzing cryptocurrency trends include:
- Moving Averages (MA), both simple and exponential, help smooth out price action and identify the direction of the trend.
- The Relative Strength Index (RSI) measures the speed and change of price movements to identify overbought or oversold conditions.
- The Moving Average Convergence Divergence (MACD) shows the relationship between two moving averages and can indicate momentum shifts.
- Bollinger Bands provide insights into market volatility and potential overbought or oversold conditions.
- The Fibonacci Retracement tool helps identify potential support and resistance levels based on previous market movements.
Are there any specific patterns that tend to repeat in cryptocurrency charts?
Yes, there are specific patterns that traders look for as they tend to repeat in cryptocurrency charts. These include head and shoulders, double tops and bottoms, wedges, flags, and pennants, among others. Each pattern signals either a continuation or a reversal of a trend. It is important to note that while these patterns can be indicative, they are not foolproof, and traders should use them in conjunction with other technical analysis tools and proper risk management.
How does news and market sentiment influence technical analysis for cryptocurrencies?
News and market sentiment play a significant role in cryptocurrency markets and can influence the effectiveness of technical analysis. Positive or negative news can quickly change market sentiment, leading to spikes or drops in prices that may not be immediately reflected in technical indicators or patterns. Therefore, while technical analysis is a valuable tool, incorporating fundamental analysis and staying up-to-date with market news and sentiment can provide a more comprehensive approach to trading cryptocurrencies.


